Today’s changing and competitive environment spurs energy companies to optimize their expenditures and improve operating efficiency. GeoArray Technologies helps Upstream companies address industry challenges through our services and innovative technology solutions.
Tasks solved by FracArray & GeoArray technologies
- Monitoring of hydraulic fracturing
- Control of waterflooding
- Estimation of ports productivity after multistage hydraulic fracturing
- Identification of production well drainage area (by natural pressure depletion)
- Mapping of fault structures
- Control of underground gas storage
- Case study #1: Monitoring of hydraulic fracturing
- Case study #2: Example of unilateral crack
- Case study #3: Experimental verification of reliability of FracArray technology results
- Case study #4: Plain view mapping of microseismic events during hydraulic fracturing process
- Case study #5: Multistage hydraulic fracturing
- Case study #6: Control of waterflooding operations during the injection of the working agent into the reservoir
- Case study #7: Delineation of well drainage area
- Case study #8: Microseismic monitoring of hydraulic fracturing and full passive monitoring
- Case study #9: Estimation of ports productivity after multistage hydraulic fracturing
- Case study #10: Identification of the fault-block structure near a bottom-hole
- Case study #11: Complex interpretation of pre-existing fracture and results of MicroSeismicPRM long-duration microseismic monitoring
- Case study #12: Control of underground gas storage
Case study #1: Monitoring of hydraulic fracturing
West Siberia oilfield.
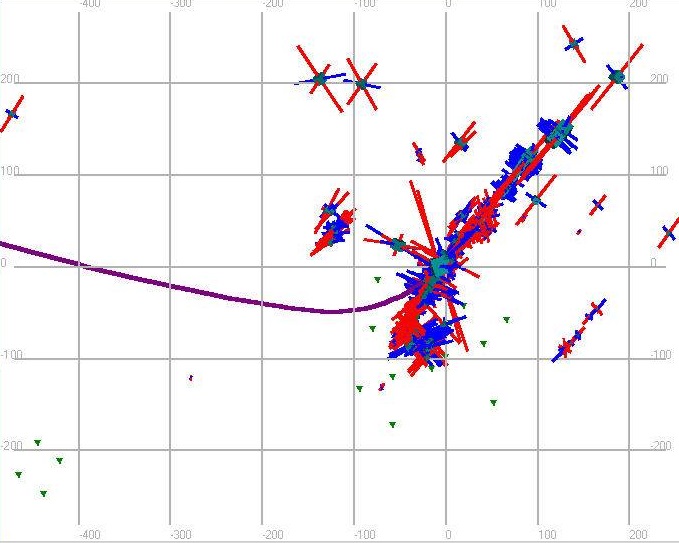
Source Mechanisms. Directions of the main axes of stress during hydraulic fracturing
West Siberia oilfield
Case study #2: Example of unilateral crack
Komi, Russia. oilfield
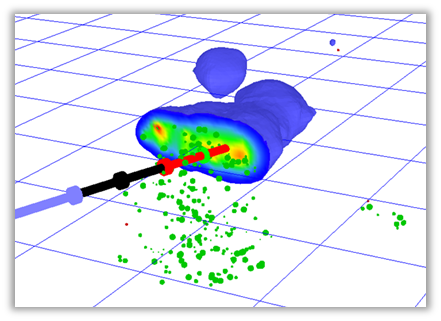
Case study #3: Experimental verification of reliability of FracArray technology results. Case of the big crack during fracturing
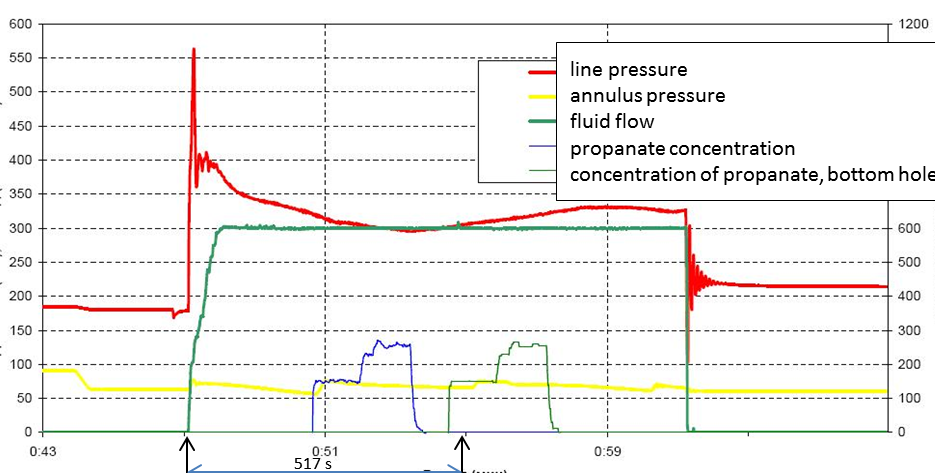
Depth 2538 m, Crack length 510 m, Tight oil (Bashen formation), West Siberia oilfield.
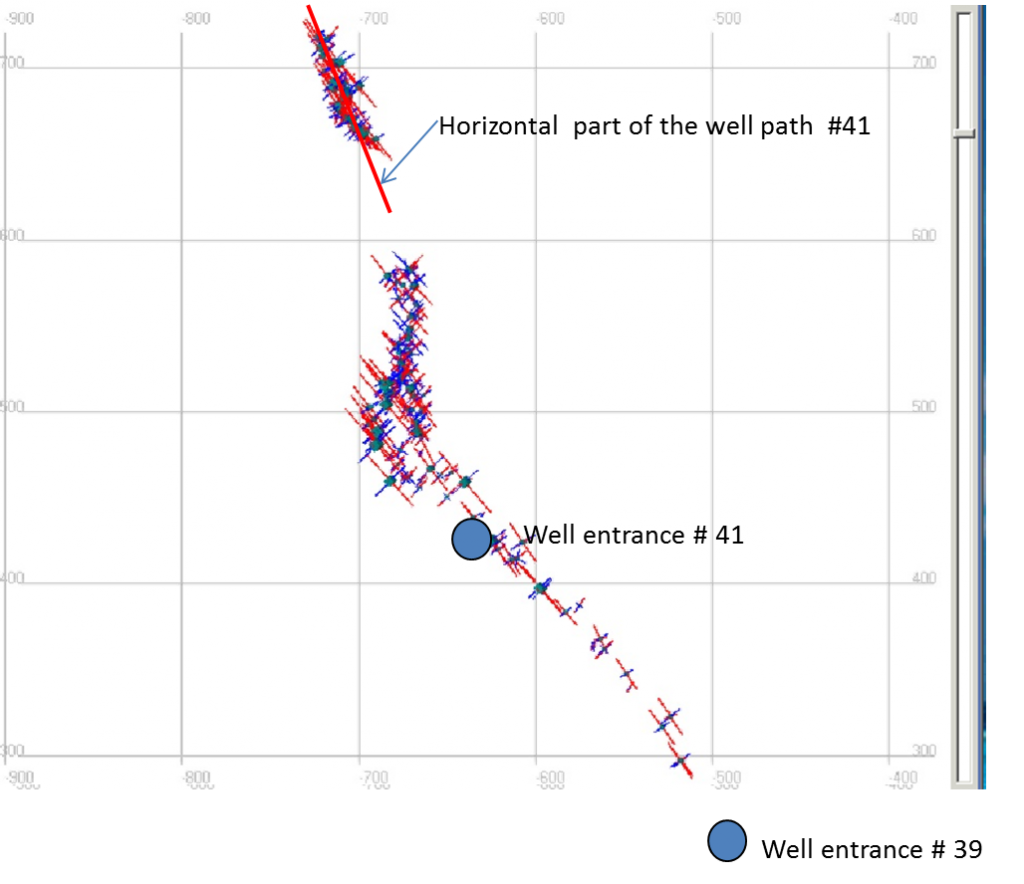
FracArray mapping of microseismic events for Step 1 & Step 2 in quasi-real time.
The oil influence of well #41 decreased from 60 tons per day to 40 tons per day on the next day after fracturing in well #39
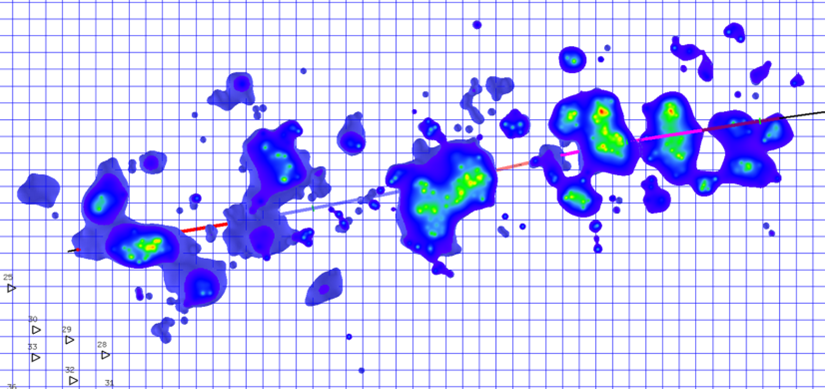
Case study #4: Mapping of filtration water channels during hydraulic fracturing in oilfield
Case study #5: Multistage Fracturing
A summary of the results of monitoring of hydraulic fracturing in 7 ports. West Siberia oilfield. West Siberia oilfield
The results of monitoring of hydraulic fracturing in the 1st port.
 The results of monitoring of hydraulic fracturing in the 1st port.
The results of monitoring of hydraulic fracturing in the 1st port
Case study #6: Waterflooding Monitoring displacement front during fluid injection in the layer.
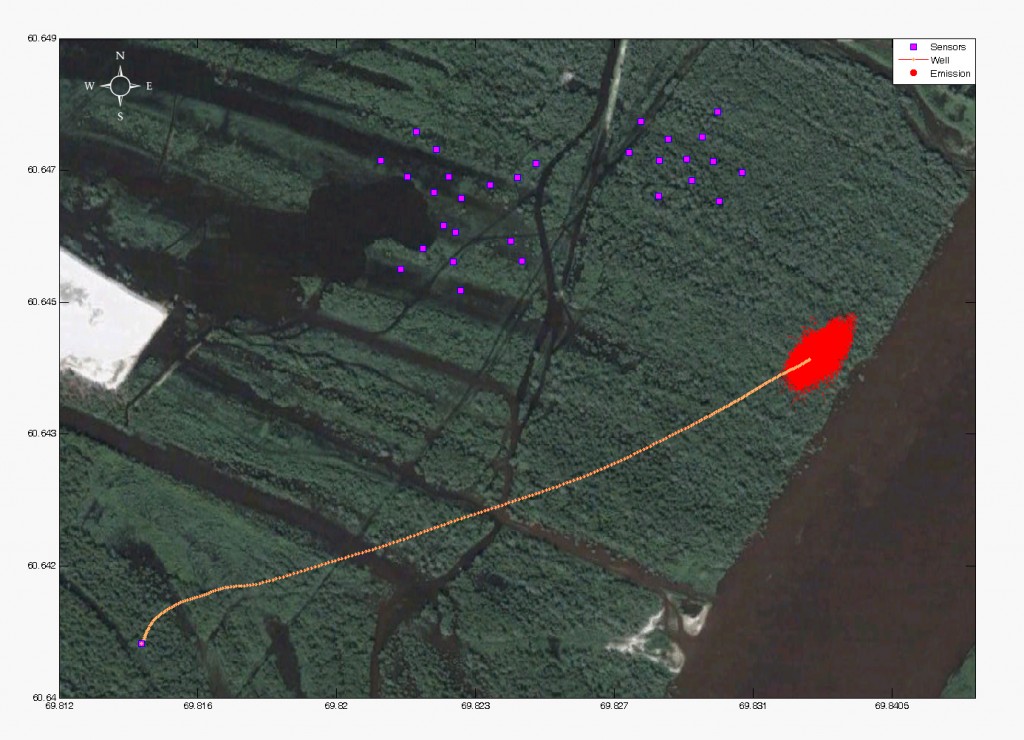
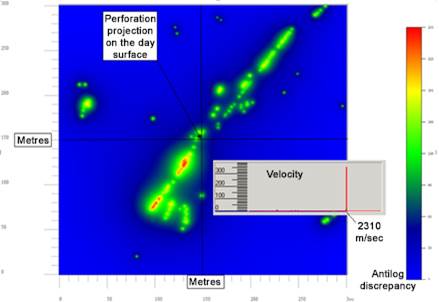
Space image . Projection of well sources of seismic emission and sensors on the day surface. Depth 2403 m. West Siberia oilfield
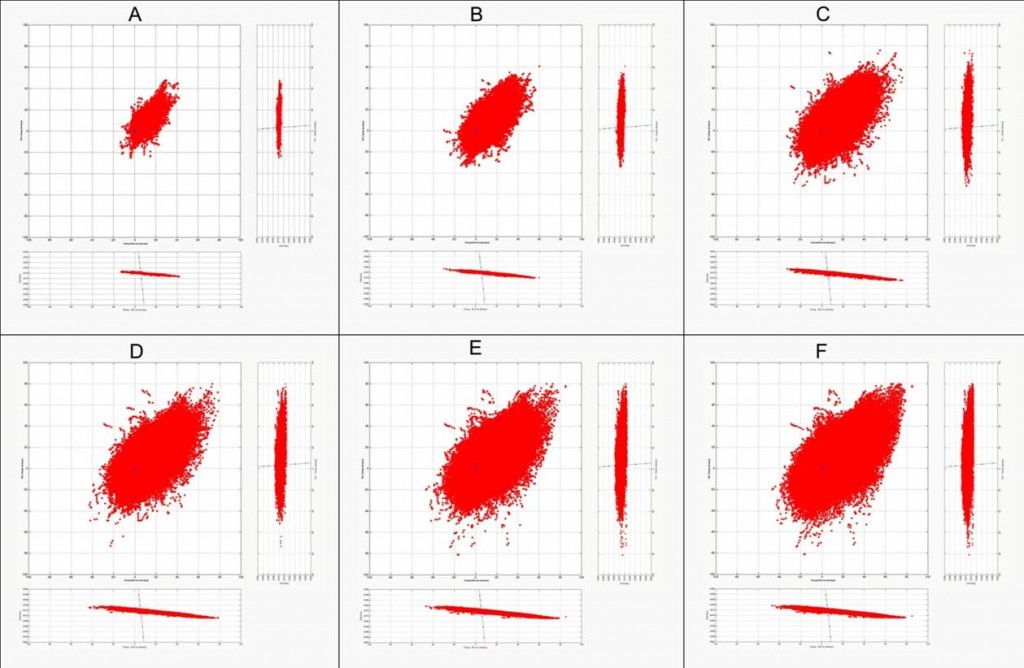
Distribution of flooding, in accordance with the extension of the zone of seismic emission. Step - 100 hours. Top view (center), east view (right) and north view (bottom) of the microseismic cloud (A) 100 hr, (B) 200 hr, (С) 300 hr, (D) 400 hr, (E) 500 hr, (F) 600 hr after the start of the injection
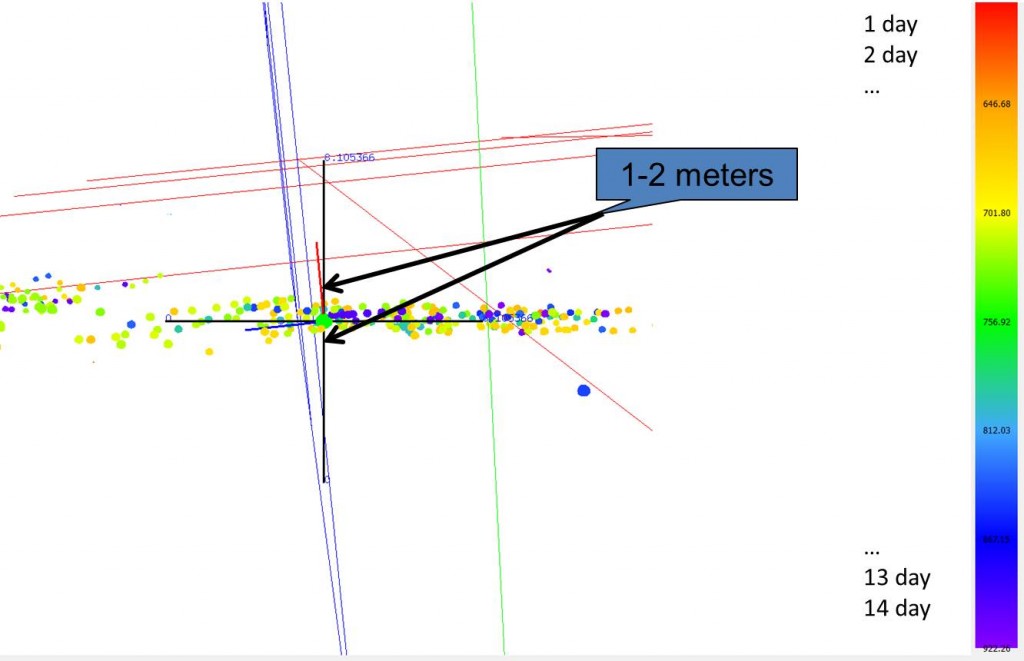
Case study #7: Estimation of drainage area of deposits

The layout of surface sensors and oil wells . Time data collection – 30 days.
West Siberia oilfield.
Case study #8: Microseismic monitoring of hydraulic fracturing and full passive monitoring (green )
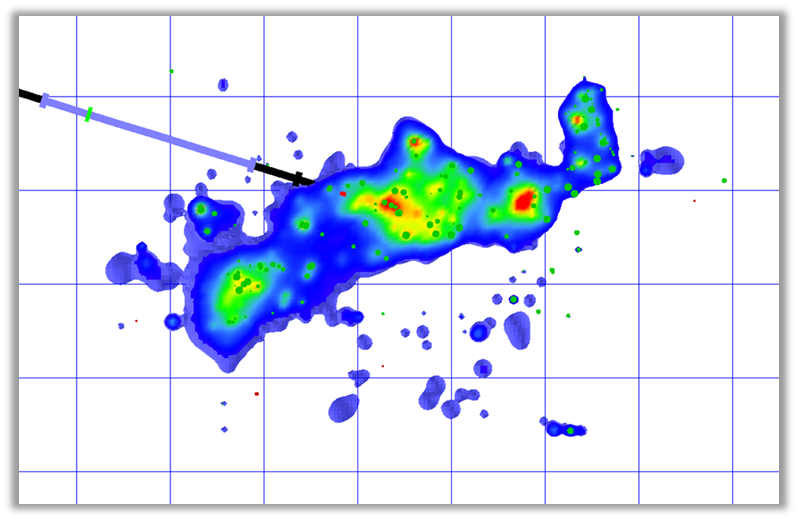
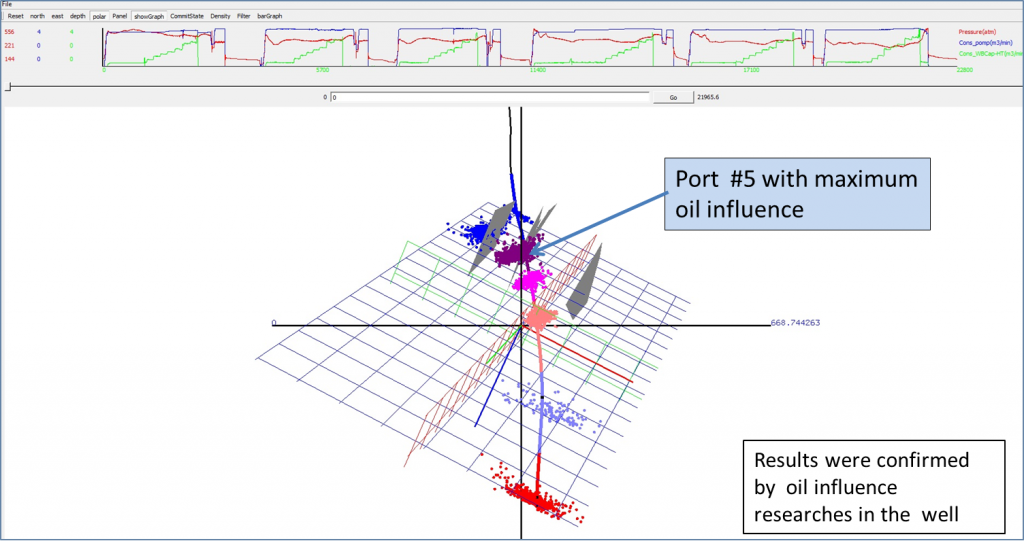
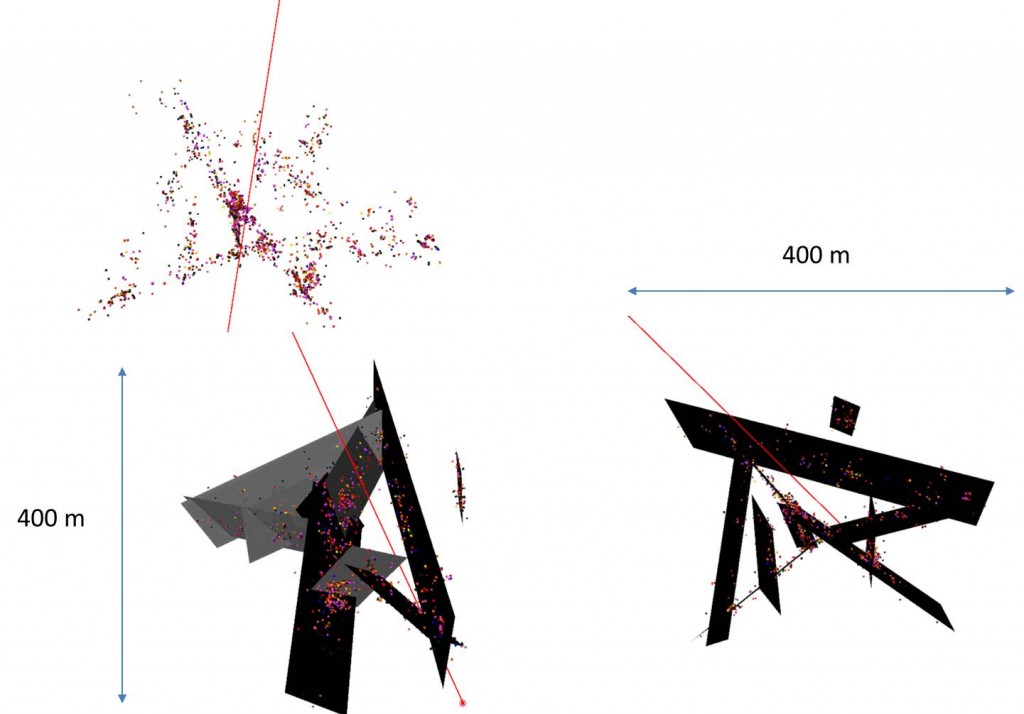
Case study #9: Estimation of ports productivity after multistage hydraulic fracturing
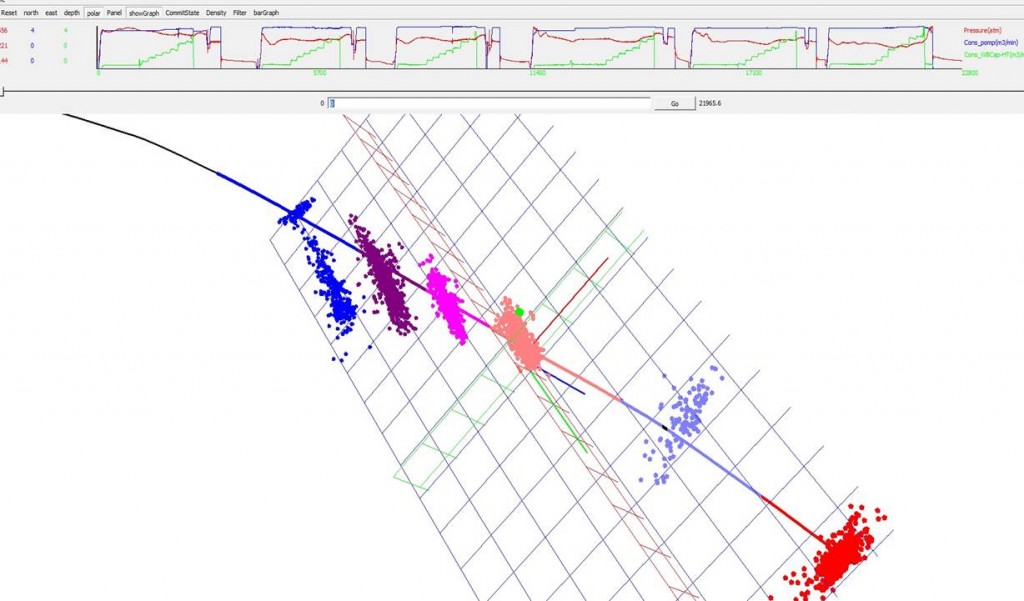
3D image of microseismic monitoring the multistage fracturing.
Grid step 50 m. West Siberia oilfield. Depth – 2700 m.
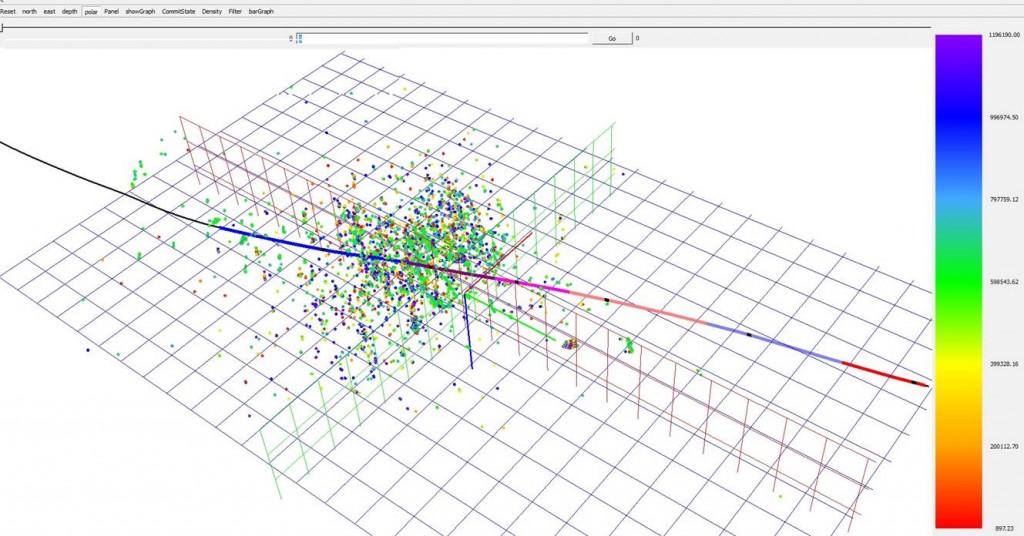
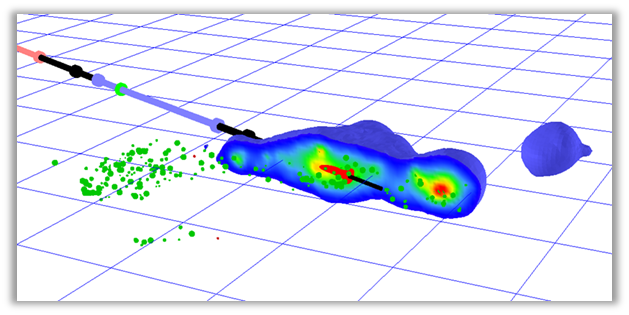
3D image of the long-duration passive microseismic monitoring after multistage fracturing.
Grid step 50m. West Siberia oilfield.
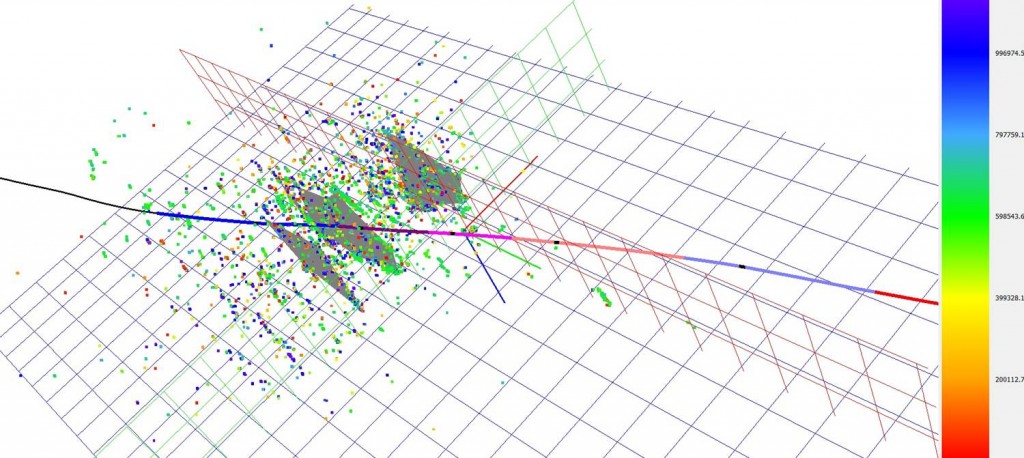
3D image of long-duration passive microseismic monitoring after multistage fracturing with fault-block structure mapping.
Grid step 50m. West Siberia oilfield.
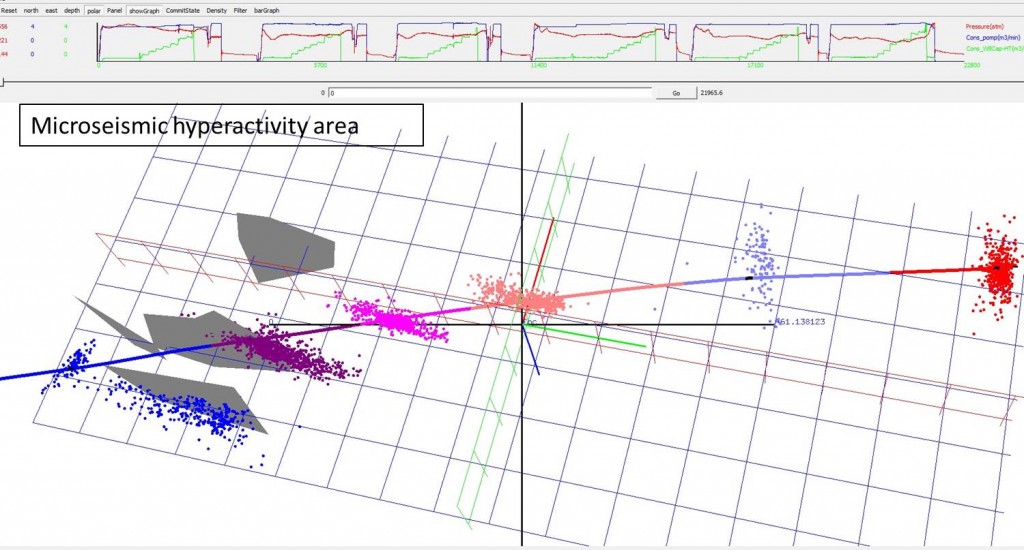
3D image of microseismic monitoring of multistage fracturing with fault-block structure mapping.
West Siberia oilfield .
3D image of microseismic monitoring of multistage fracturing with fault-block structure mapping.
Grid step 50m. West Siberia oilfield


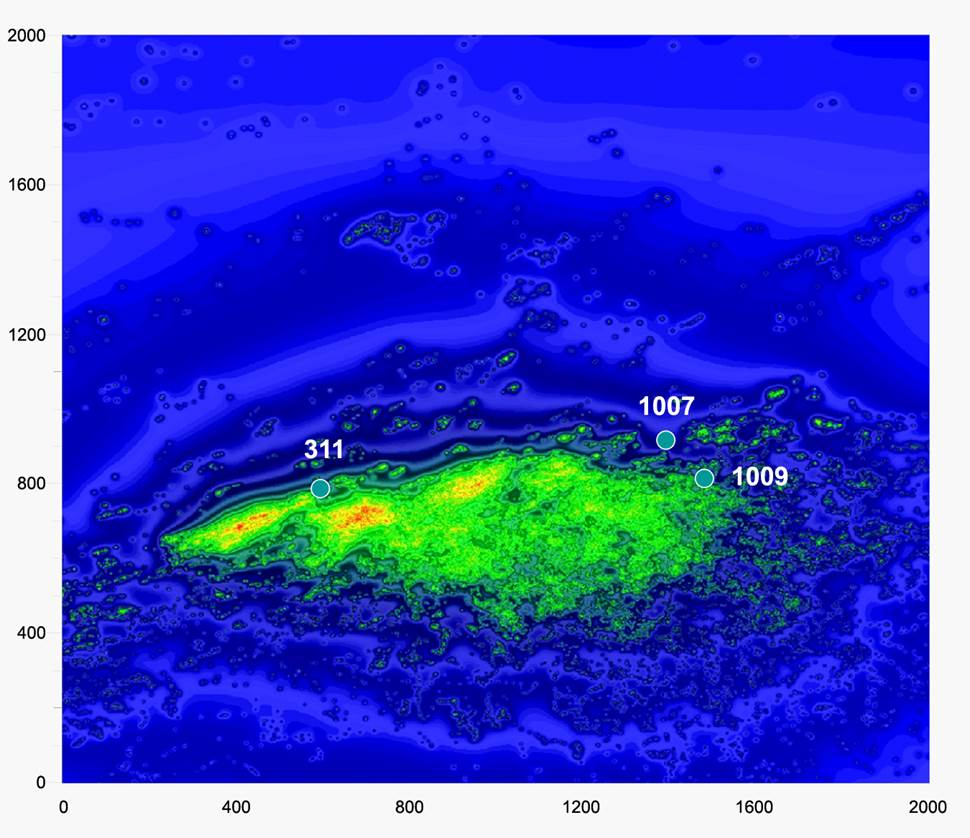
2D image (map) of long-duration passive microseismic monitoring after microseismic monitoring of multistage fracturing with pre-existing fracture after CSPD-PSTM 3D processing.
West Siberia oilfield.

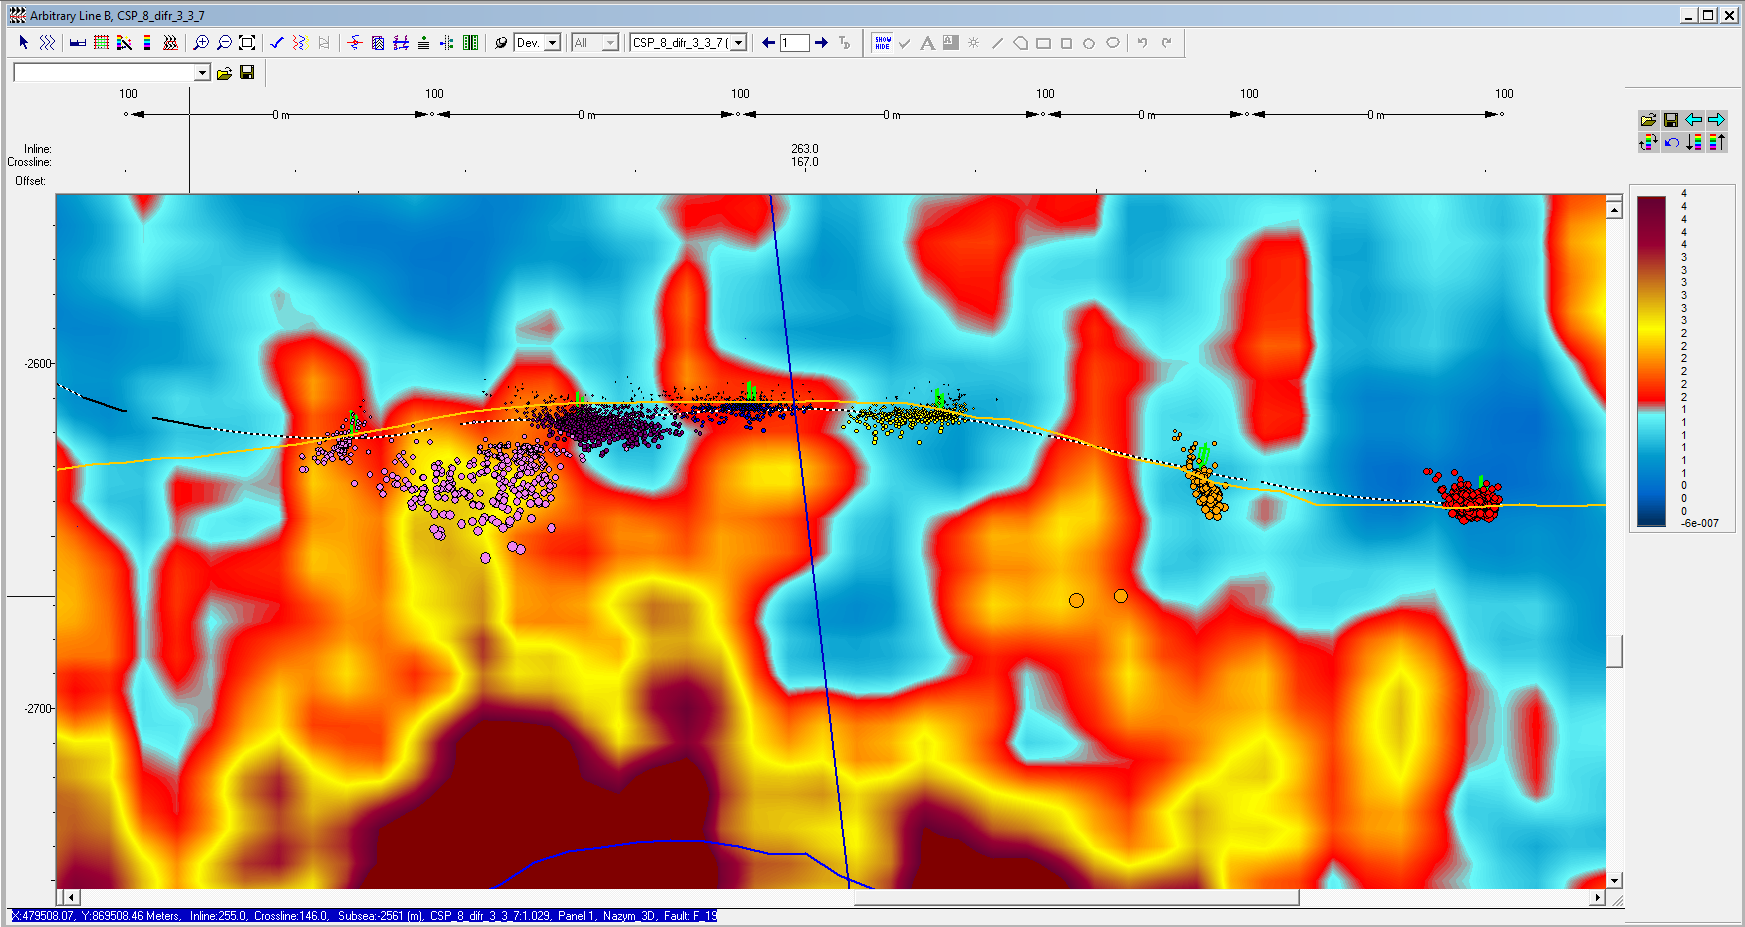
Vertical slice of pre-existing fracture according CSDP CSP-PSTM 3D processing along profile line, passing through the hole.
Case study #10: Identification of the fault-block structure near a bottom-hole.
Two weeks of data collection per well.
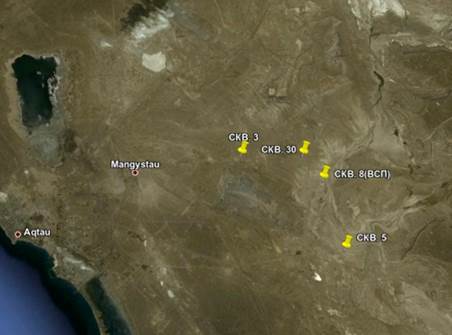
Layout of wells and surface sensors' positions. Wells #3,5 – equipped with pumping units.
Well #30 – without pumping units. Kazakhstan.
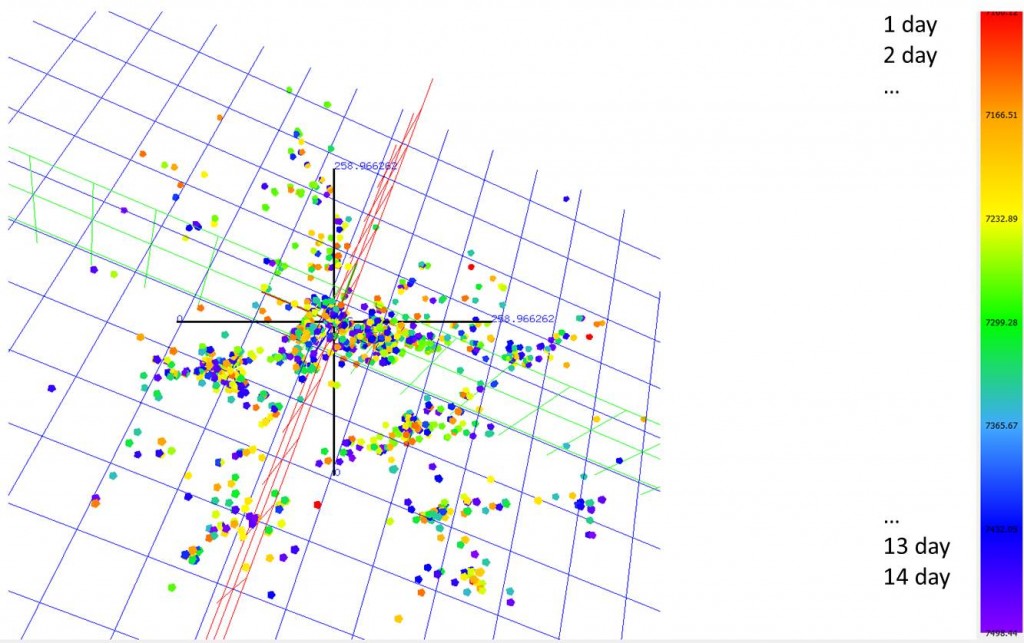
3D view of microseismic events near borehole bottom. Grid size - 50 m. Well #5, Kazakhstan
3D view of microseismic events near borehole bottom. Grid size - 50 m. Kazakhstan
3D view of microseismic events near borehole bottom. Grid size - 50 m. Kazakhstan
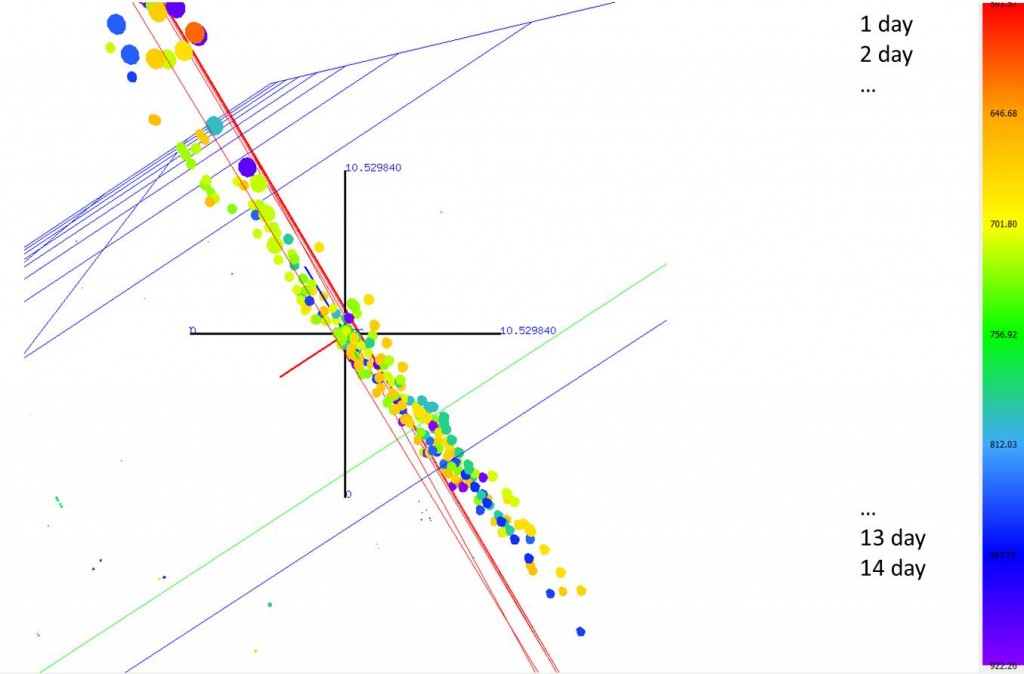
3D view of microseismic events near borehole bottom. Kazakhstan
3D view of microseismic events near borehole bottom. Kazakhstan
3D view of microseismic events near borehole bottom. Grid size- 50 m. Kazakhstan
Case study #11: Integrated interpretation of pre-existing natural fracture and results of CSPD long-duration microseismic monitoring
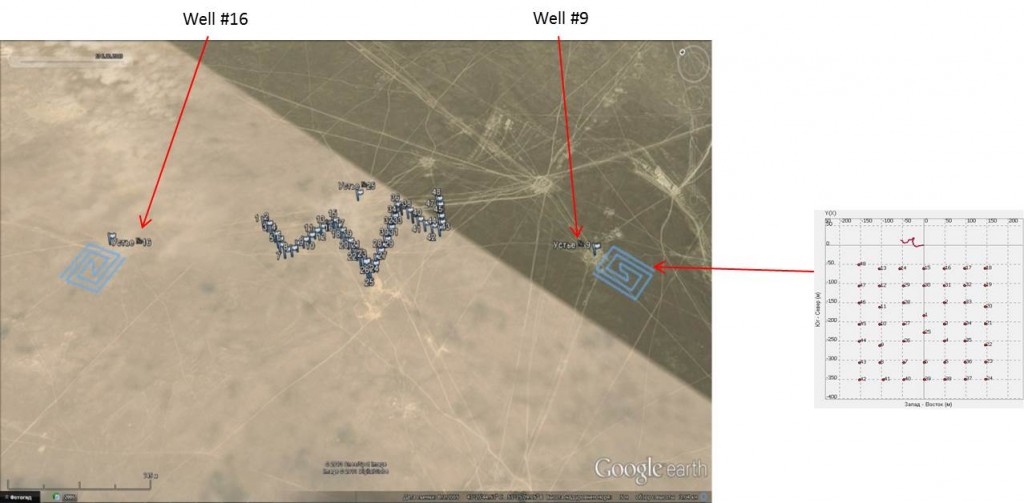
Layout map of surface receivers array and the wells.Two week registration per well. Kazakhstan, Array 300×300 m.
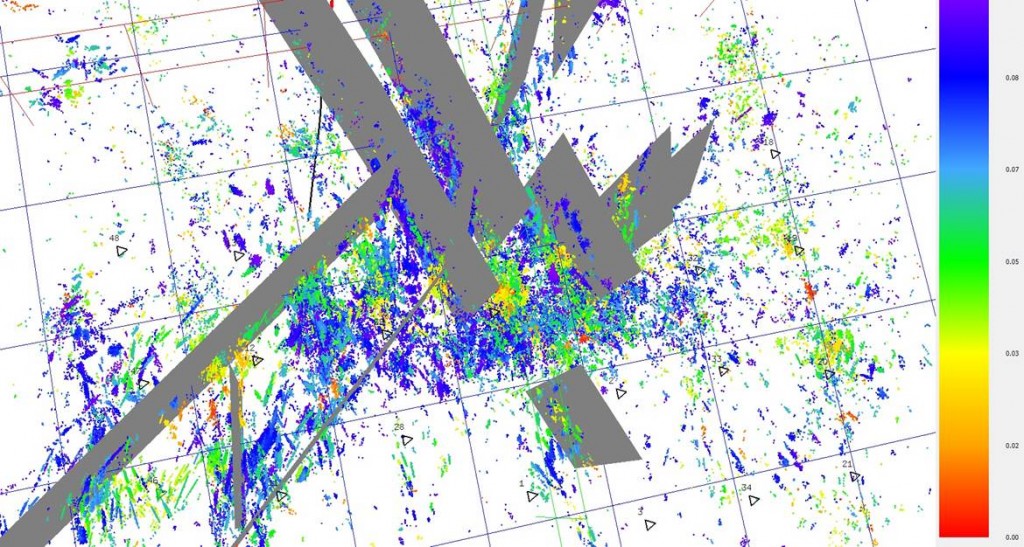
3D view of microseismic events near bottom-hole, well #9. Mapping of the fault-block structure near the bottom of wells.
Two weeks of observations. Grid step -50 m., well #9 with oil pumping unit. Kazakhstan
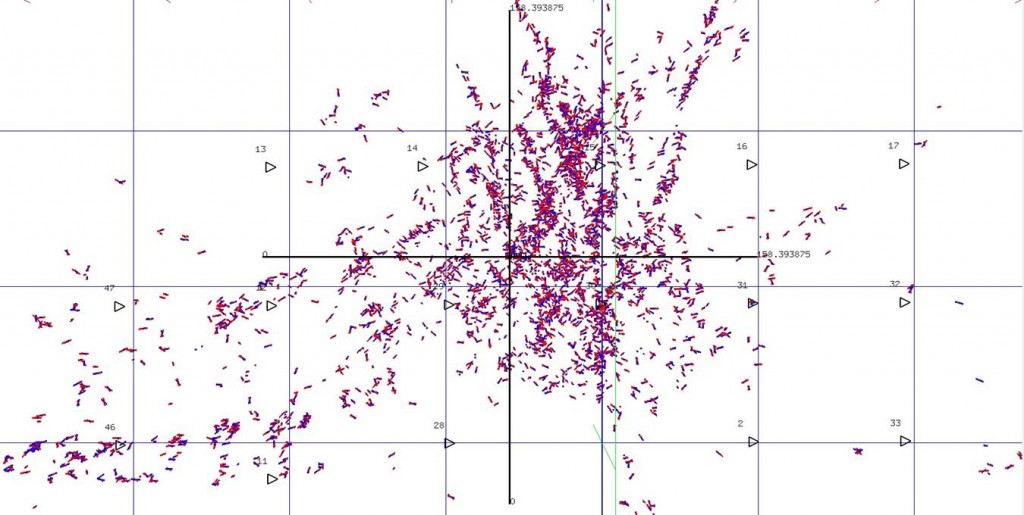
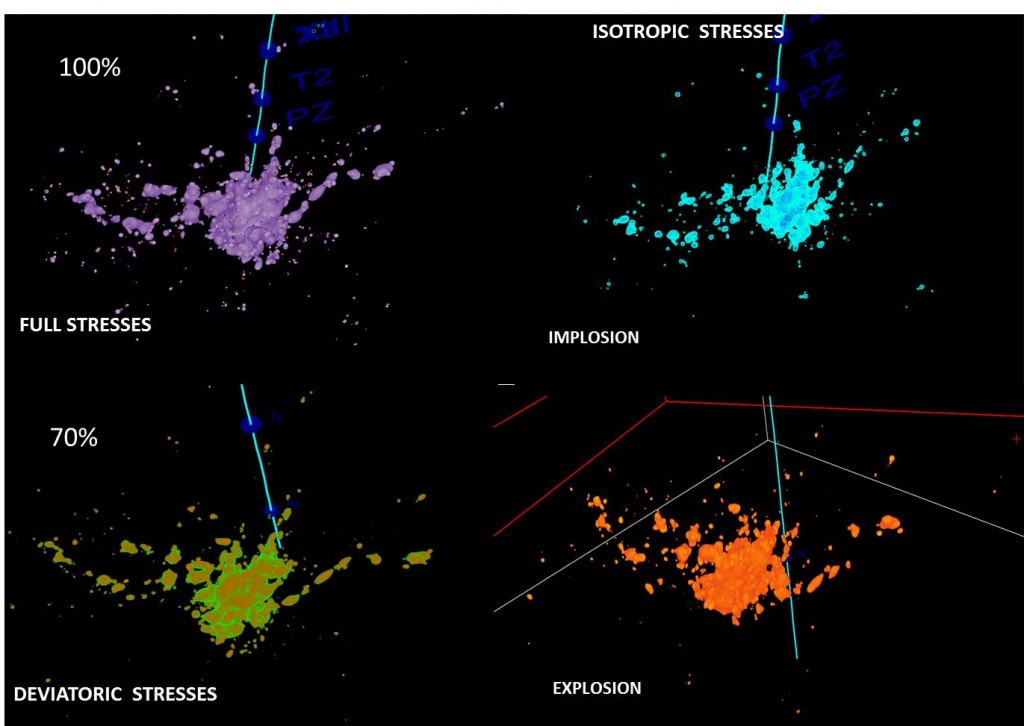
Microseismic event distribution with 3D visualization of seismic moment tensor on principal stress axes. Well #9. Grid size - 50 m.
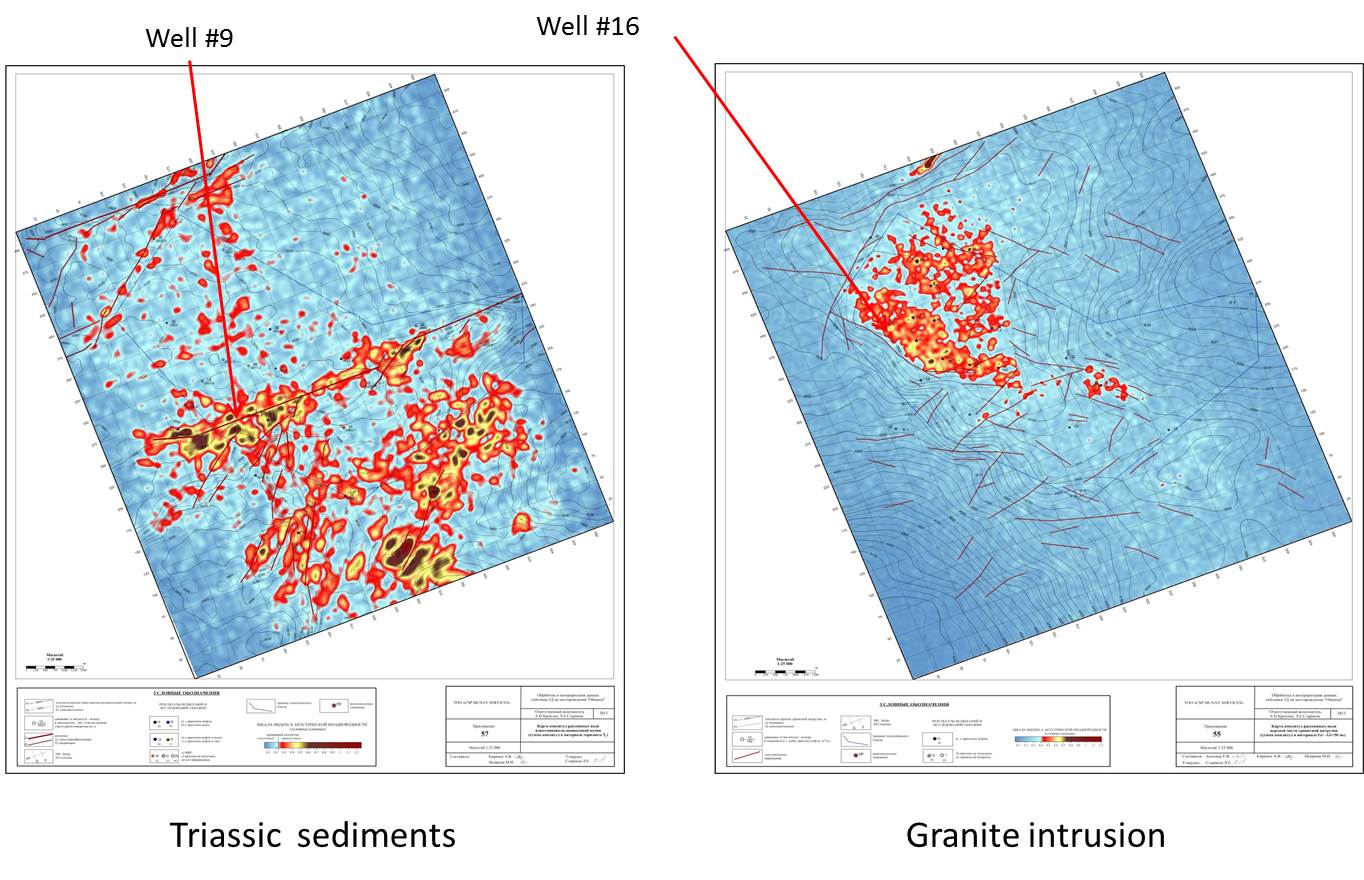
CSPD–maps of pre-existing fracture
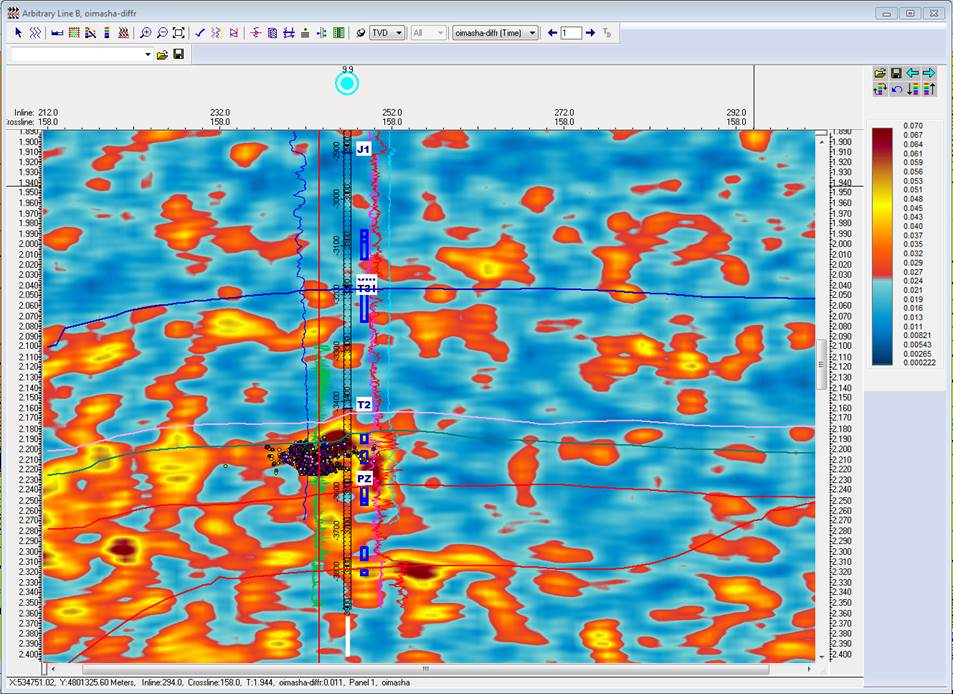
Time section of CSPD-diffractor cube (pre-existing fracture) & results of long-duration passive microseismic monitoring.
Well #9, Kazakhstan. Oil inflow 150 m3 per day
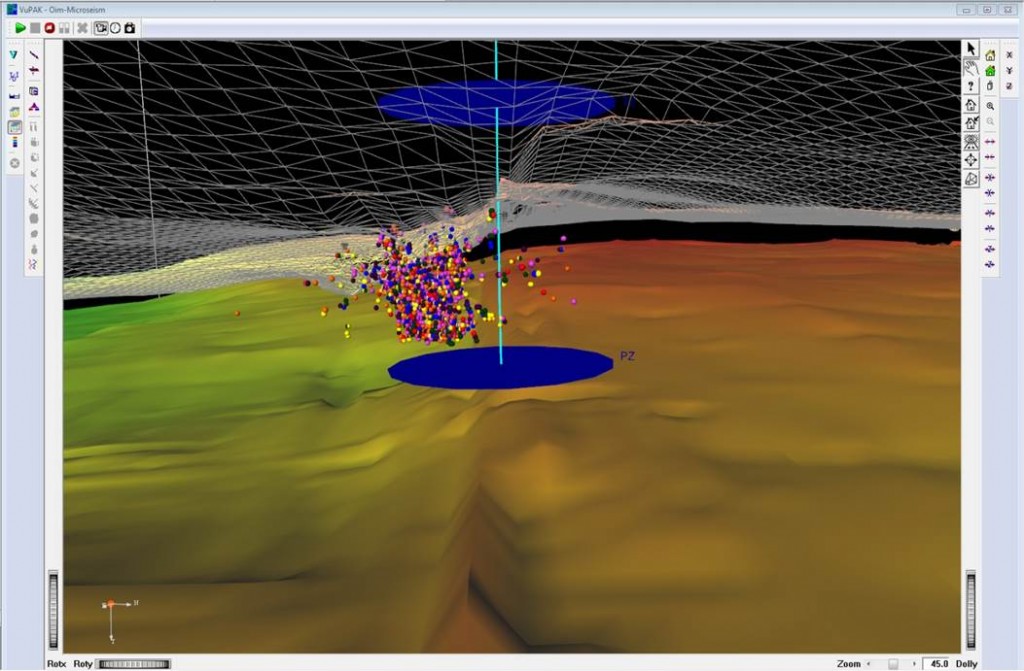
3D view of results of long-duration passive microseismic monitoring with top of Paleozoic. Well #9, Kazakhstan. Oil inflow 150 m3 per day
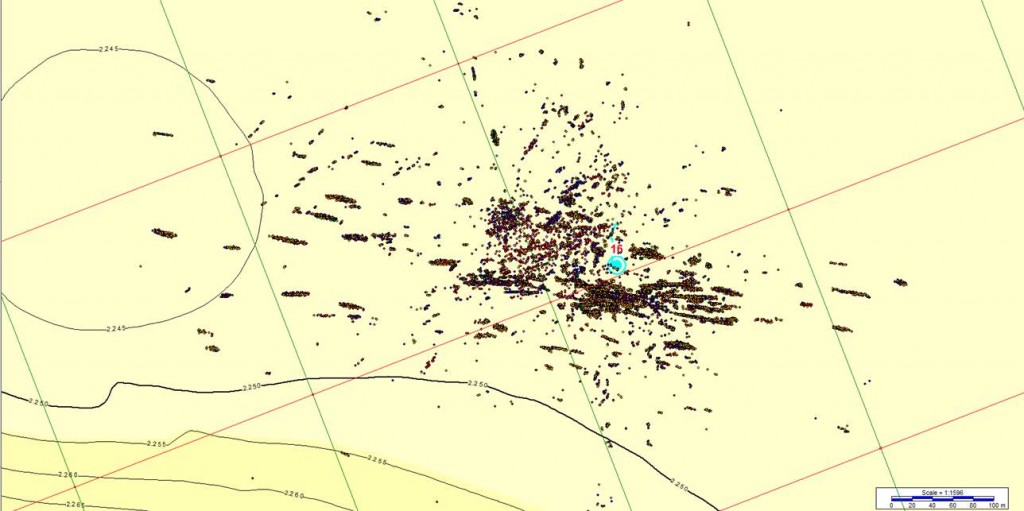
Projection of a cloud of microseismic events to an isochronous surface granite intrusion. Well #16, Kazakhstan. Oil inflow 102 m3 per day
3D view of results of microseismic events, CSPD-diffractor cube and cube of microseismic stresses. Well #9, Kazakhstan. Oil inflow 150 m3 per day
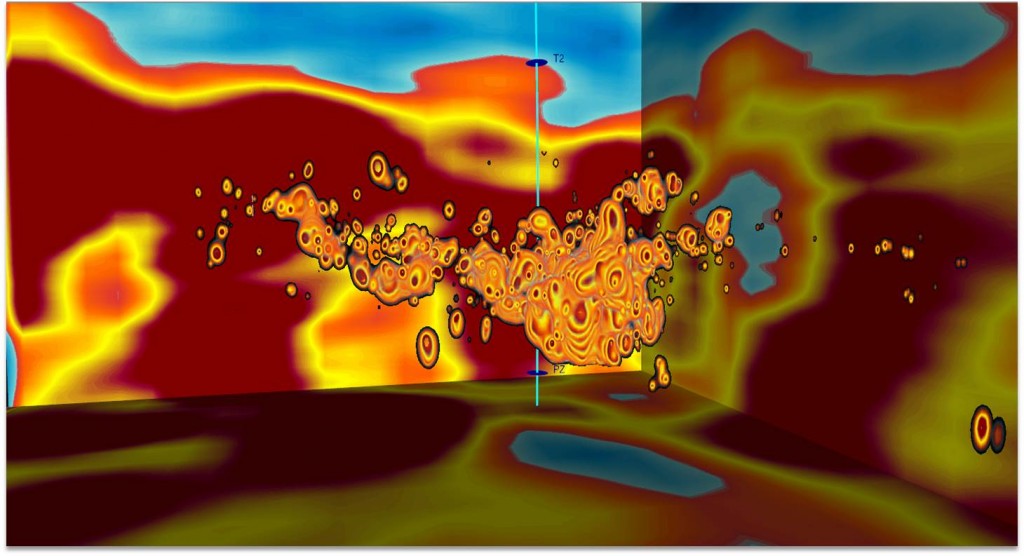
3D view of CSPD-diffractor cube and cube of microseismic stresses. Well #9, Kazakhstan. Oil inflow 150 m3 per day
3D view of results microseismic events. Well #9, Kazakhstan. Oil inflow 150 m3 per day
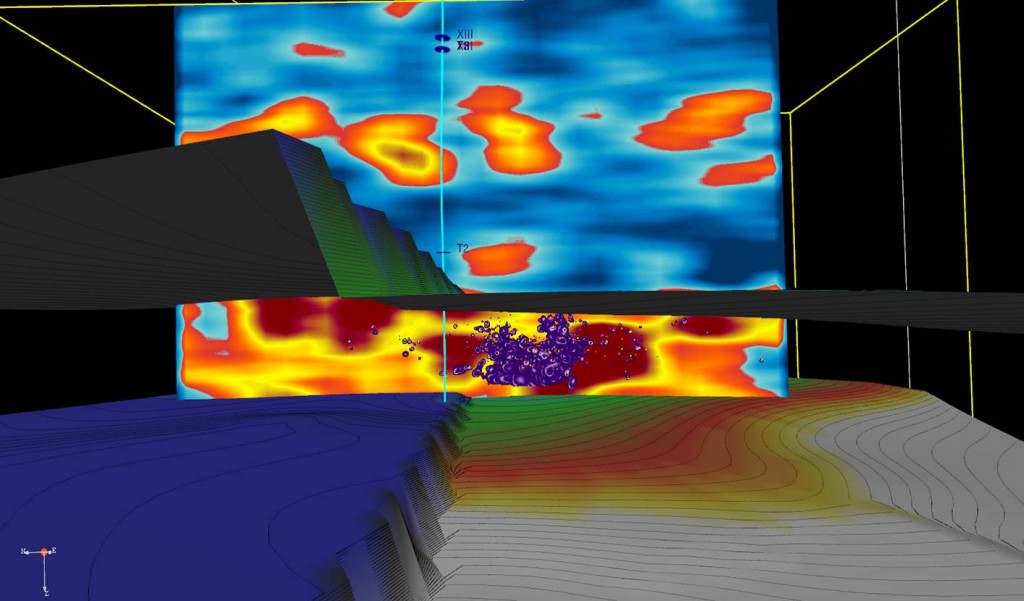
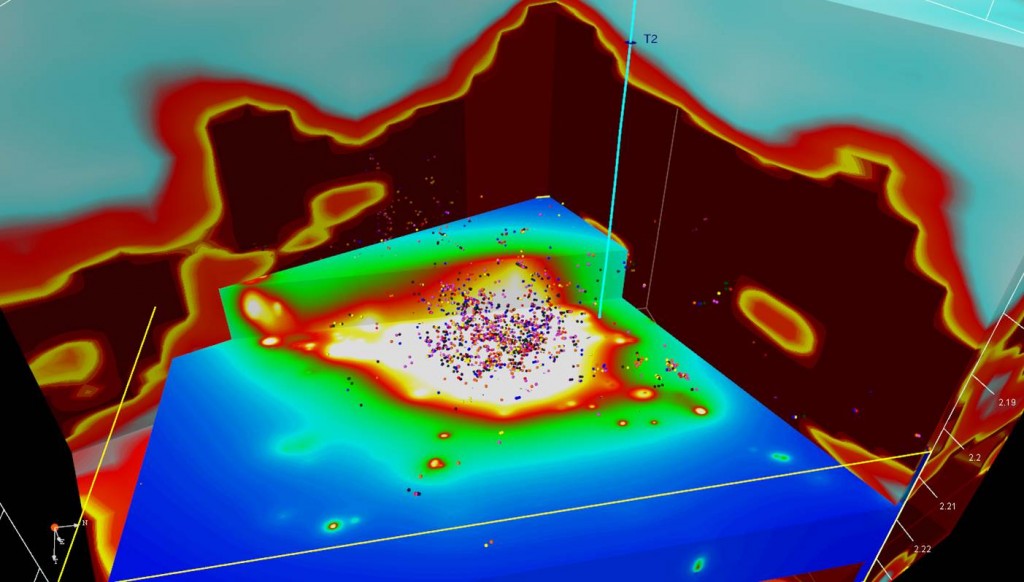
3D view of CSPD-diffractor cube and cube of microseismic stresses near the structural surfaces of middle Triassic and roof productive horizon T2.
Well #9, Kazakhstan. Oil inflow 150 m3 per day

